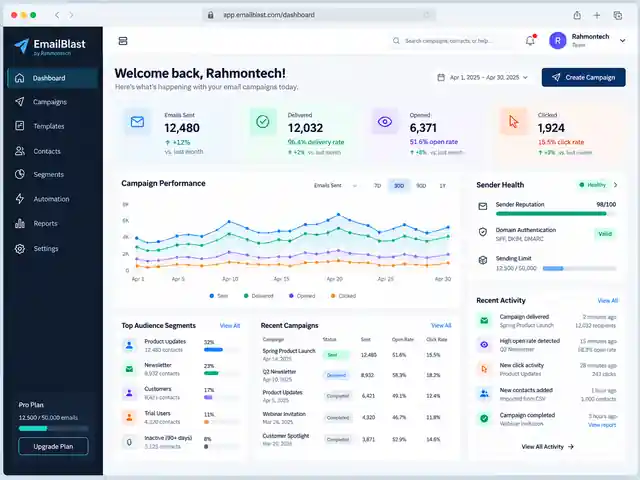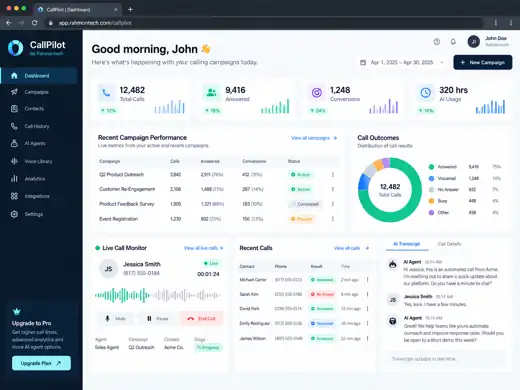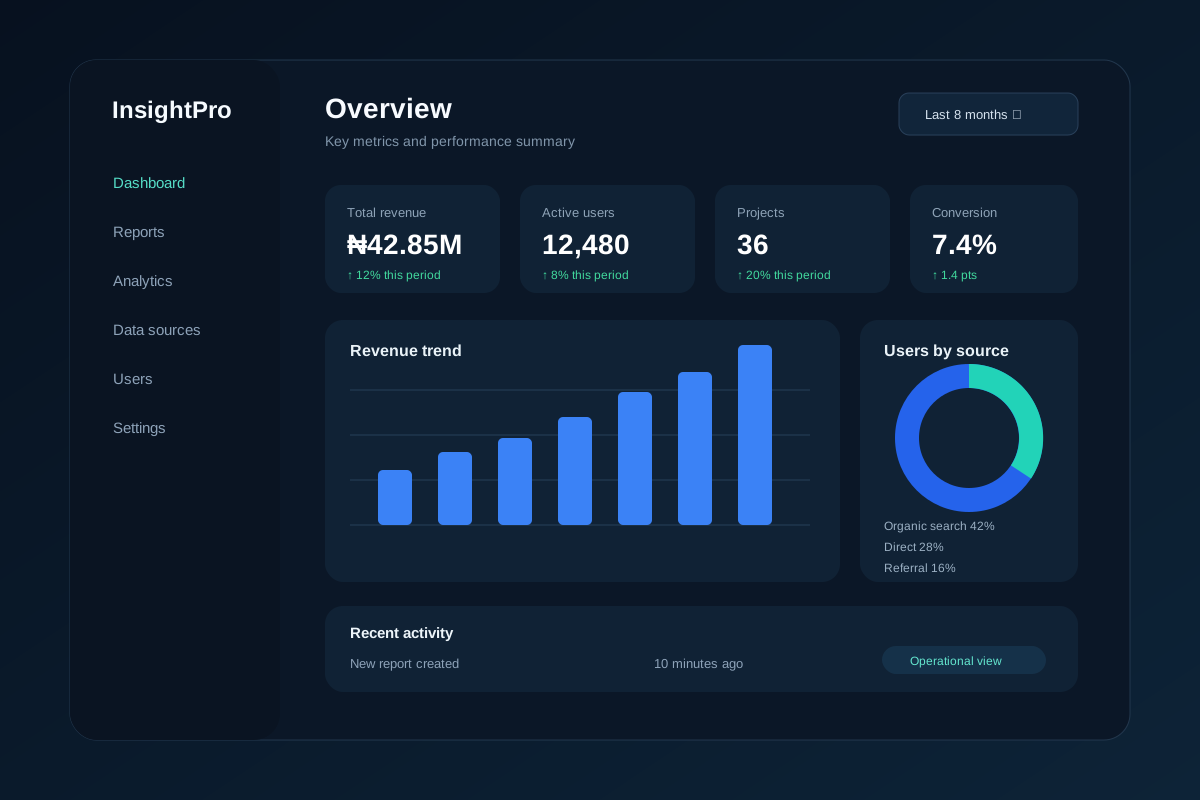
The analytics dashboard was designed to turn operational data into a single reporting workspace where teams can see the KPIs, trends and exceptions that require attention.
Project brief
Business reporting often becomes fragmented across exports, spreadsheets and individual tools. The goal of this project was to organise the most useful measures into one interface without creating a dashboard full of charts that nobody uses.
What Rahmontech designed
- Headline KPI cards for the metrics a team needs to check first.
- Date-range and reporting filters for comparing periods and segments.
- Trend charts for revenue, activity and other operational measures.
- Region, channel or category breakdowns for understanding where changes are coming from.
- Detailed tables for moving from a summary metric into the underlying records.
- Recent activity and alert areas for issues that need follow-up.
Data and product structure
The dashboard is organised so the data layer and the presentation layer can evolve independently. Source data can be normalised before it reaches the interface, while KPI definitions, permissions and refresh behaviour remain explicit instead of being hidden inside one-off reports.
Delivery outcome
The result is a decision-focused analytics product pattern: summary first, context second and detailed records when a user needs to investigate. The preview uses representative data and is not presented as a customer's live metrics.
Related capability: data, analytics and software engineering.